Free Graph Maker: Make Any Chart Online

A free graph maker for bar, line, pie and seven other chart types: add your data, style it and download it, with no signup.

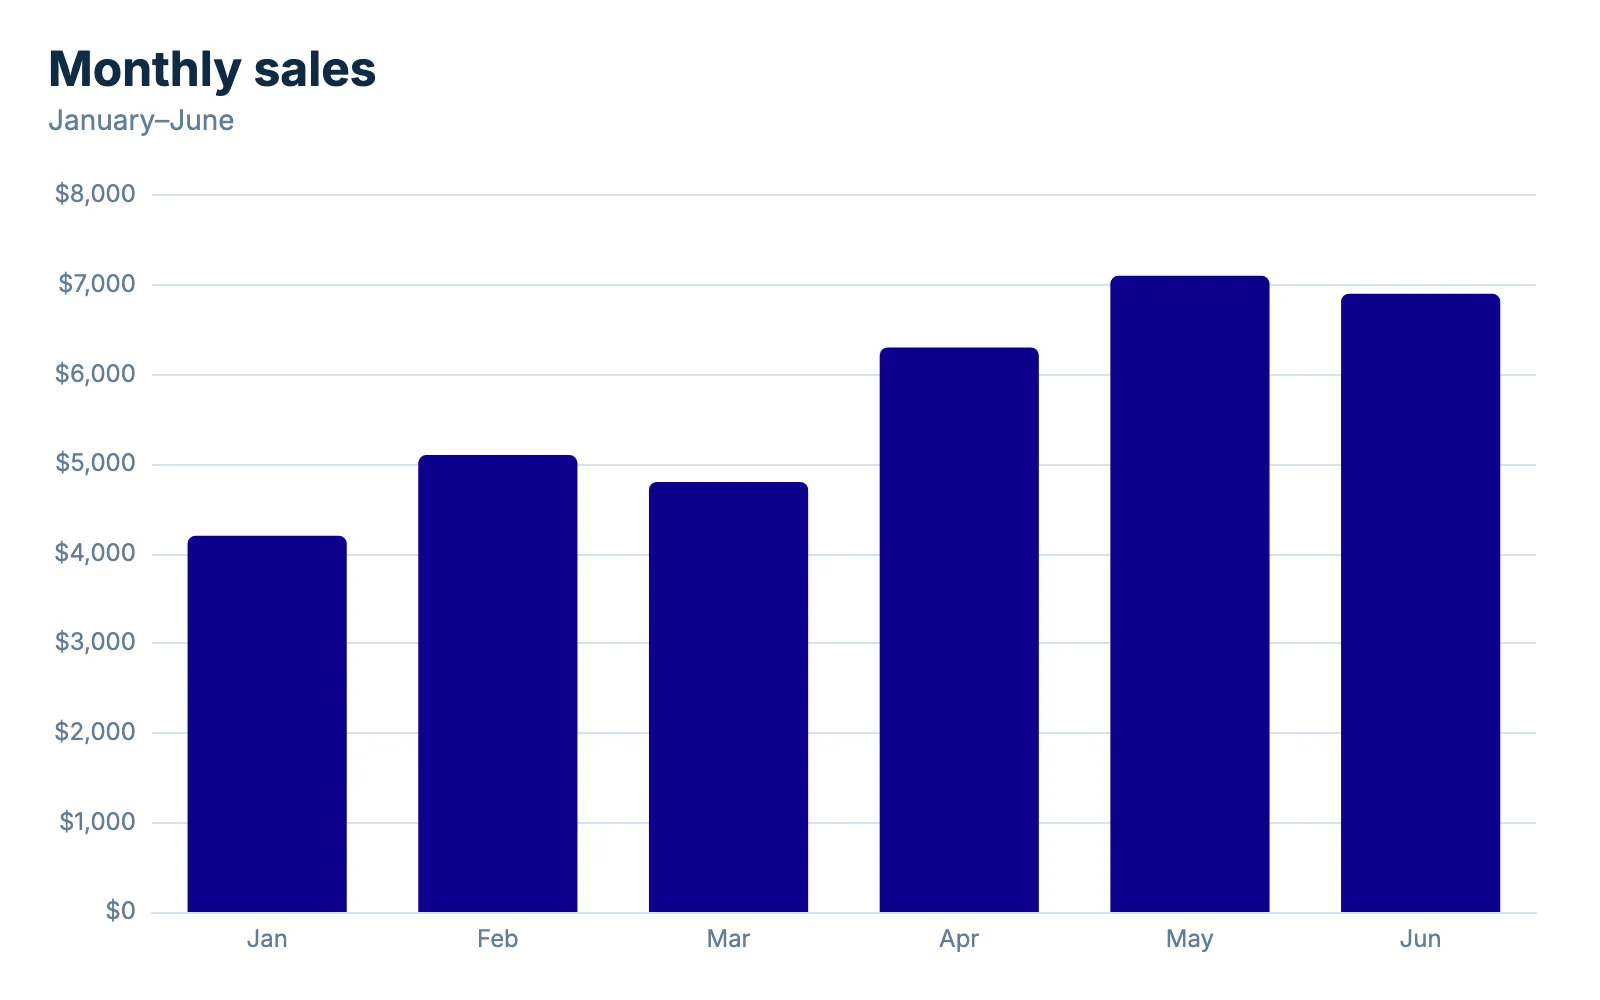
Bar chart titled Monthly sales, with one bar per month from January to June, ranging from $4,200 to $7,100 $0 $1,000 $2,000 $3,000 $4,000 $5,000 $6,000 $7,000 $8,000 Jan Feb Mar Apr May Jun Monthly sales January–June chartjuice.com

Which chart should you use?

Pick the question your data answers. Each maker opens with an example you can replace with your own numbers.

How to use this graph maker in 3 steps

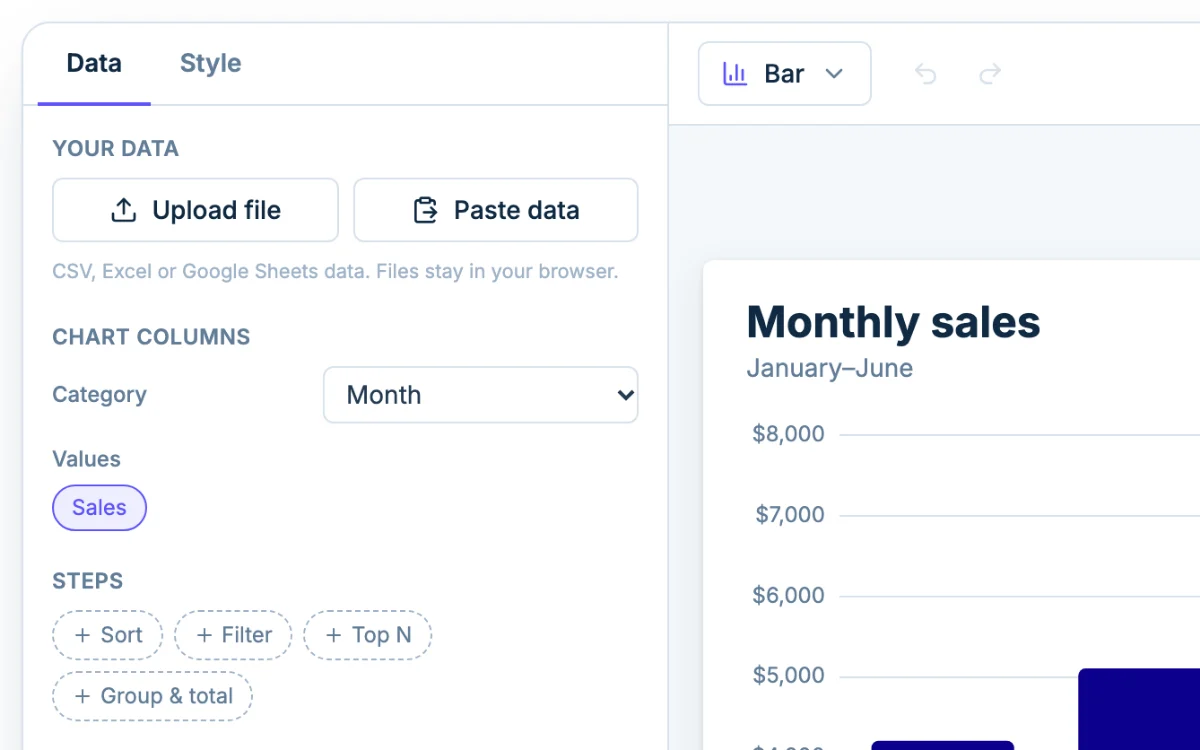
  1. The Data tab in Chartjuice, with Upload file and Paste data beside a chart
    1

    Add your data

    On the Data tab, click Upload file or Paste data, or type straight into the table under the chart.

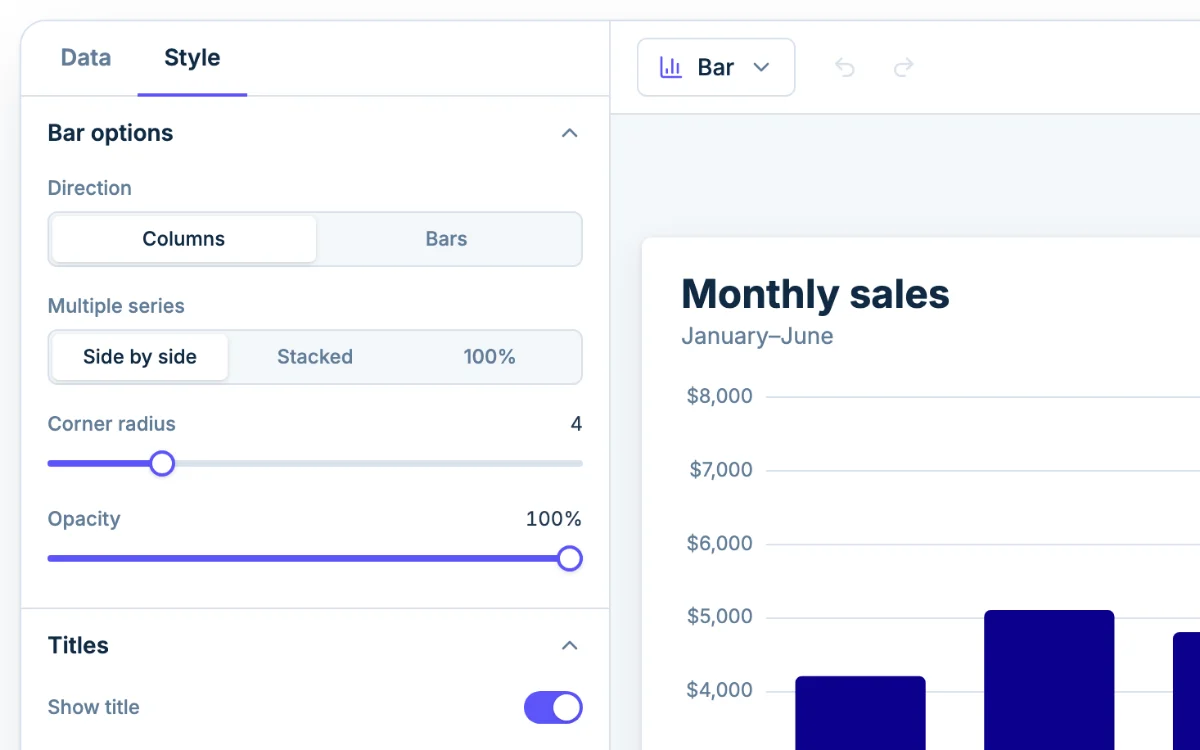
  2. The Style tab in Chartjuice, open beside a chart
    2

    Pick a chart and style it

    Choose a chart type in the toolbar, then open the Style tab to change titles, axes, legend and colors.

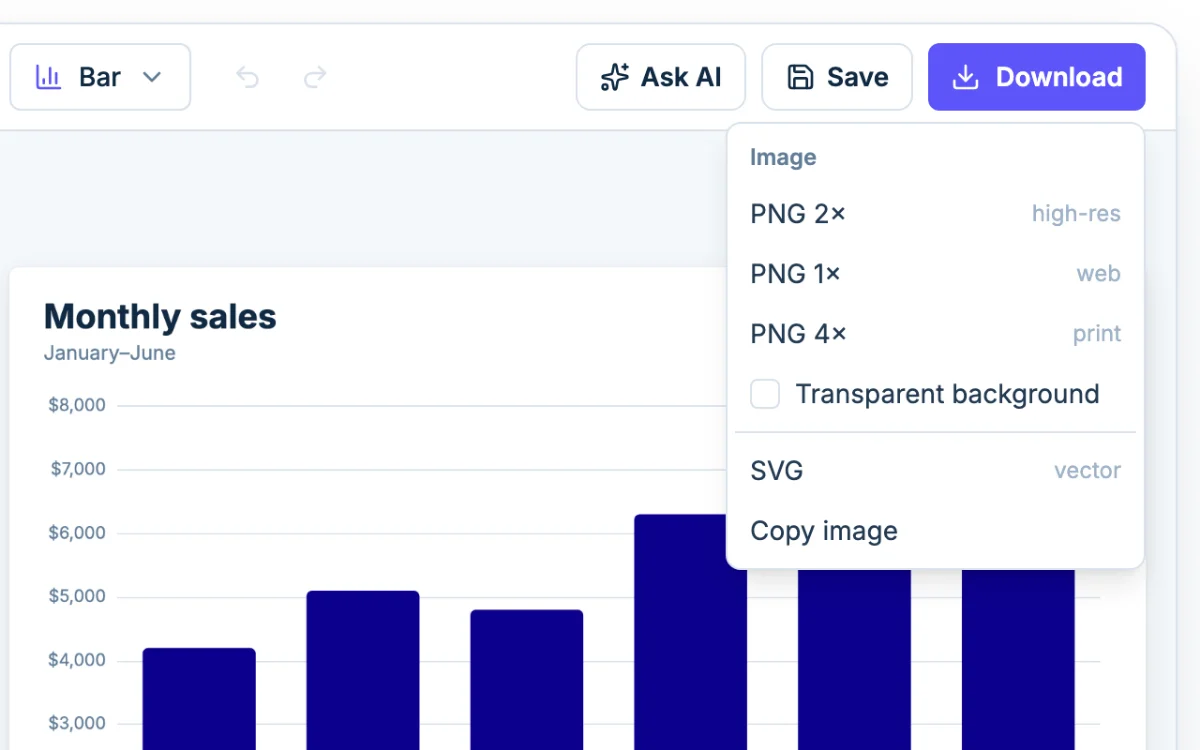
  3. The Download menu in Chartjuice: PNG at 1x, 2x or 4x, SVG and Copy image
    3

    Download it

    Click Download and choose PNG or SVG, or use Copy image to paste the chart into a document or slide.

Pick the right chart for your data

Start with what you want the reader to notice. Compare amounts with a bar graph, show change over time with a line graph, show parts of a whole with a pie chart, or check whether two numbers move together with a scatter plot. Switching chart type keeps your data, so you can try a few and keep the one that reads best. For a full walkthrough of uploads, Steps, the AI assistant and downloads, read how Chartjuice works.
From upload to download

  • Upload a file

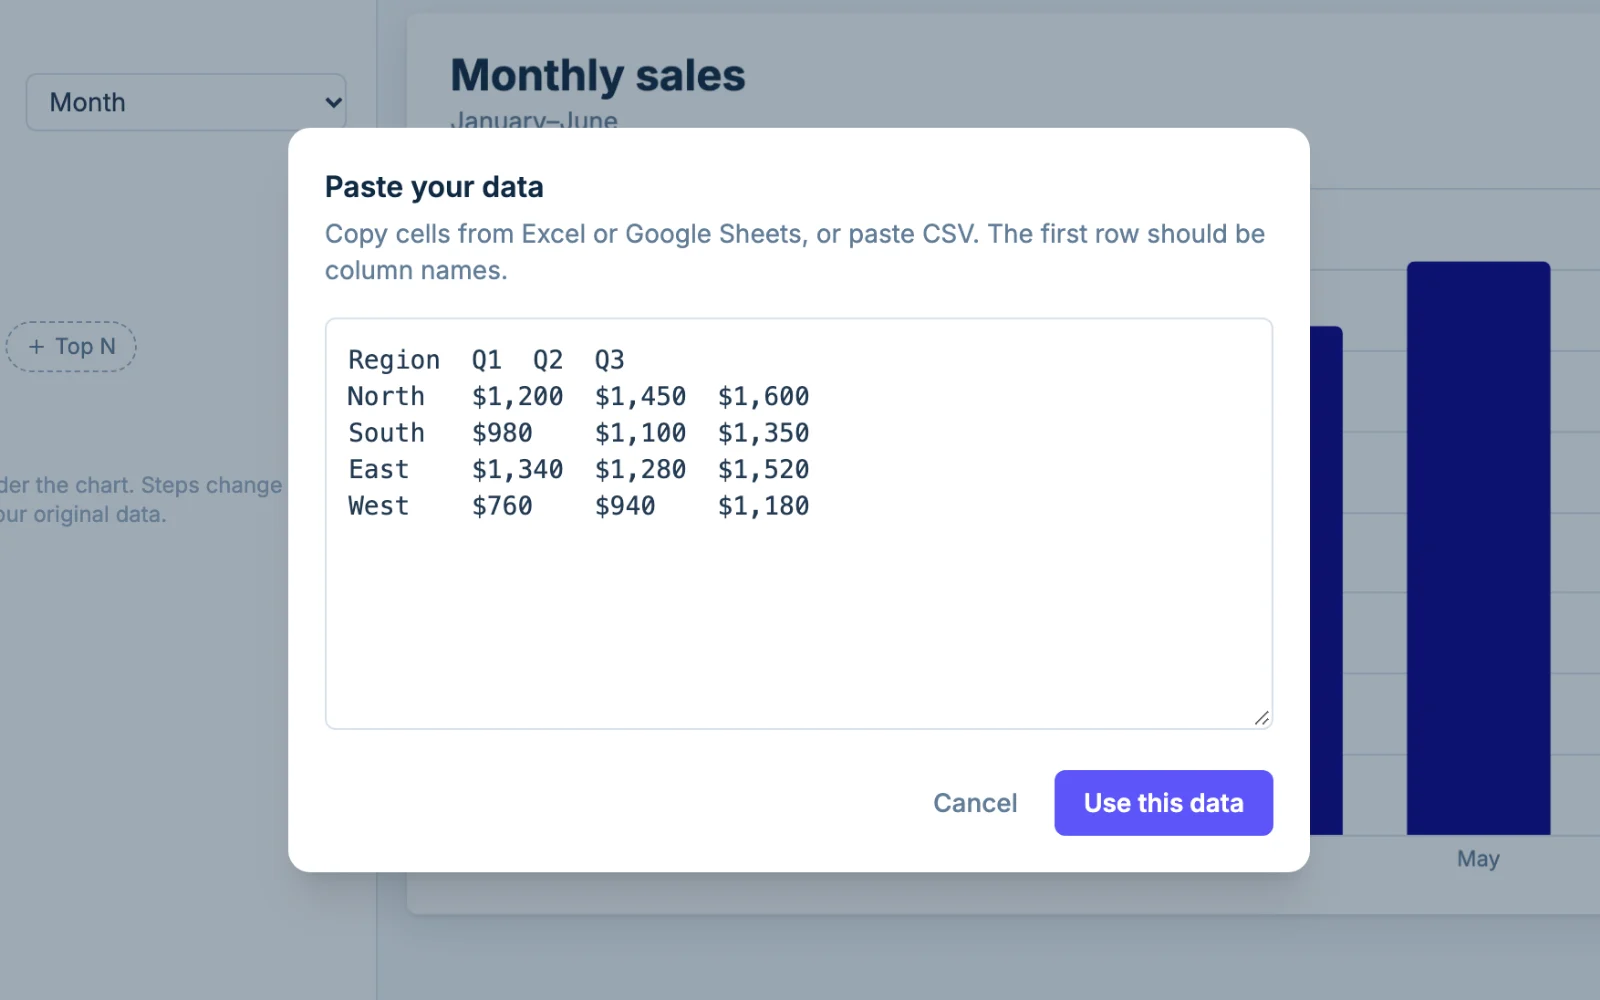
    Drop in a CSV, TSV, XLSX, XLS or ODS file, or paste from Excel or Google Sheets. Files are read in your browser and never uploaded.

    The Paste data dialog in Chartjuice with a table pasted from a spreadsheet
  • Looks good out of the box

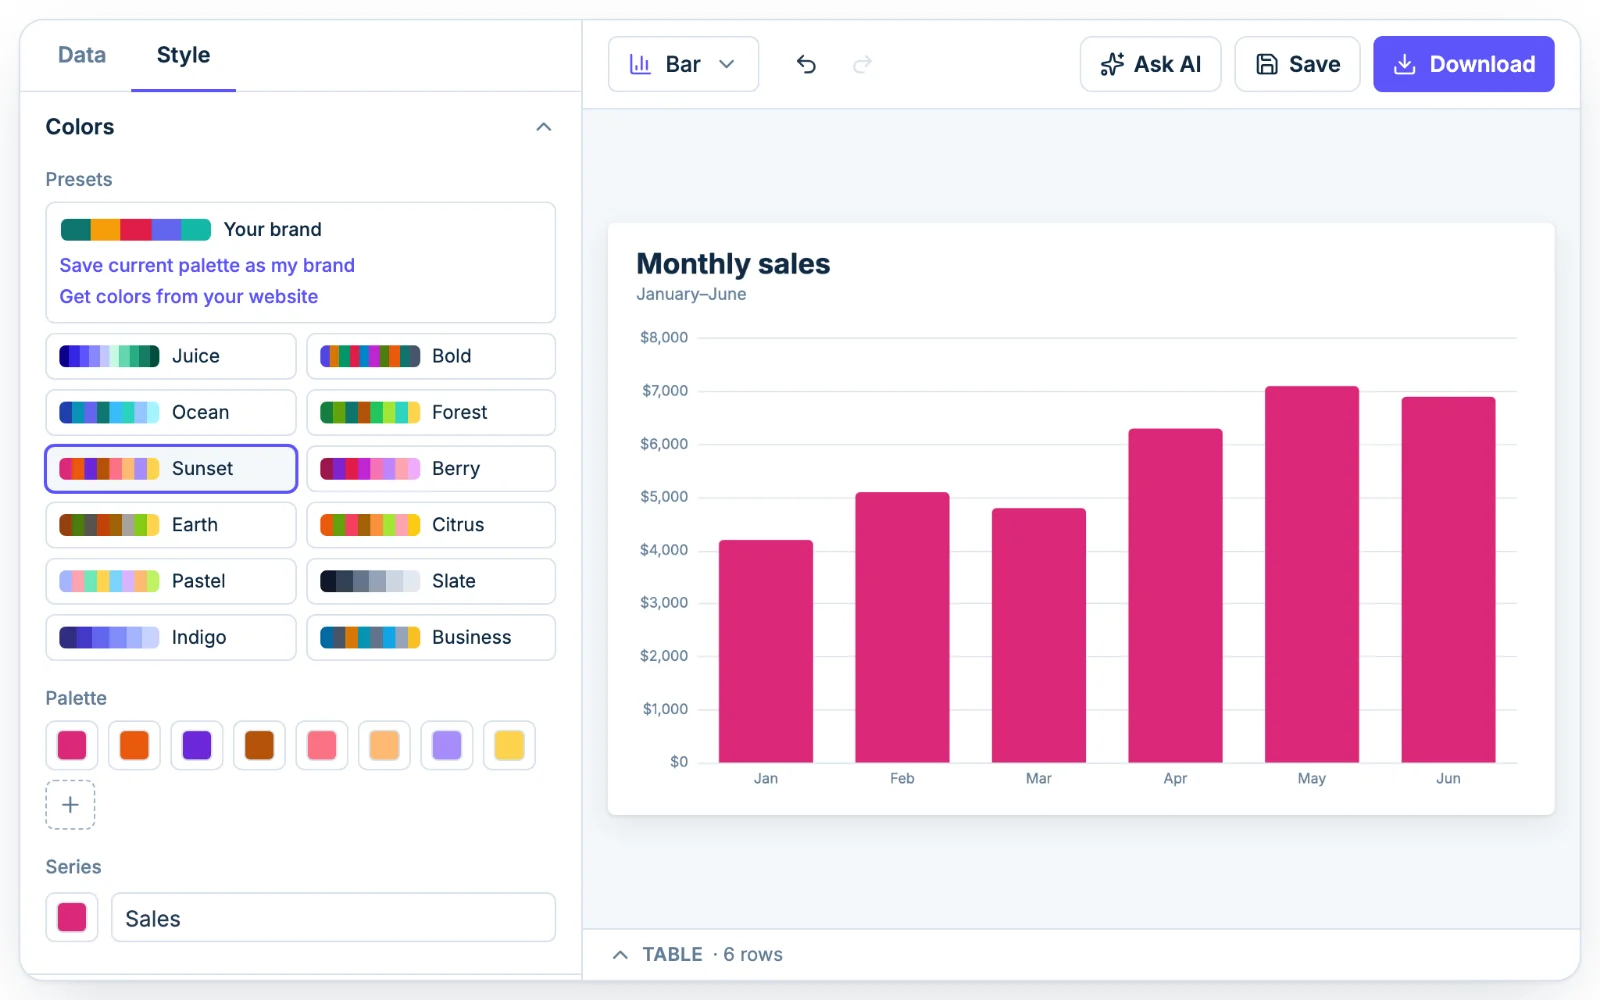
    Every chart starts with a clean palette and readable labels, so you rarely need to fix the defaults. Swap in a preset palette with one click, or save your brand colors with Pro.

    The Colors section in Chartjuice with preset palettes, open beside a chart
  • Design with AI

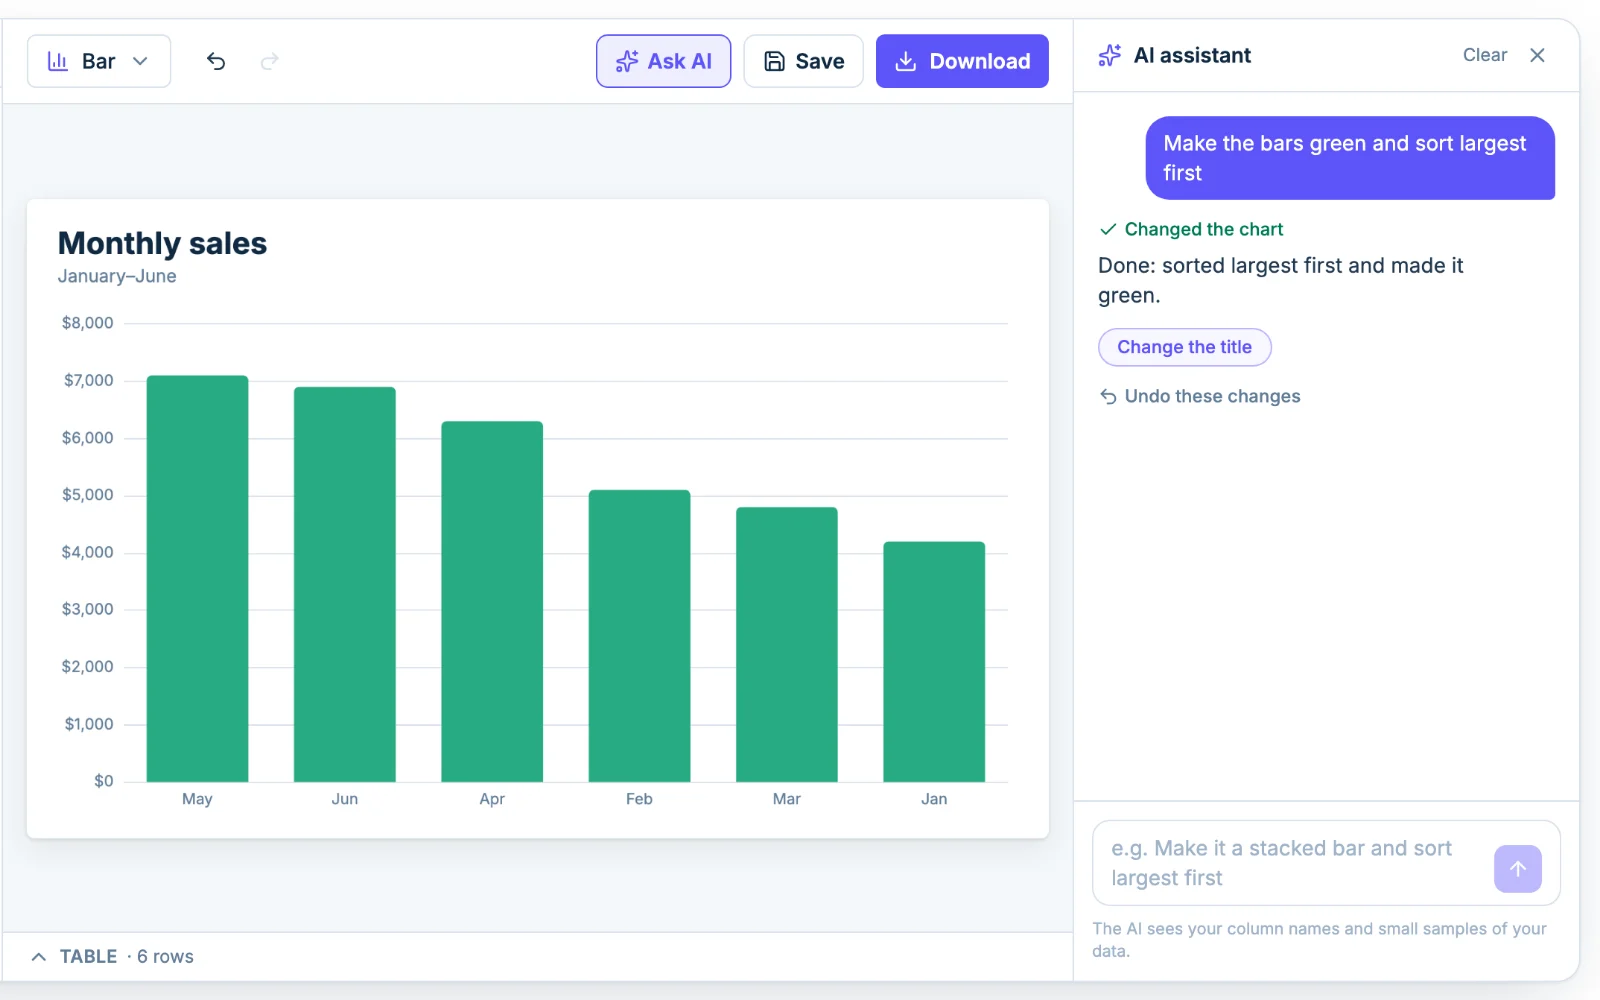
    Click Ask AI, describe the chart you want, and fine-tune the result in the Style tab. Sign in for 3 free tries. Pro gives you 50 messages a day.

    See what the AI graph maker can do

    The Chartjuice AI assistant editing a chart from a plain-English request
  • Download PNG or SVG

    PNG at 1x, 2x or 4x with an optional transparent background, or SVG. Free downloads carry a small chartjuice.com mark, and Pro removes it.

    A chart downloaded from Chartjuice as a PNG

Ask an AI assistant for a chart

You can also make a chart without opening the editor. Connect Chartjuice to an AI assistant such as Claude or ChatGPT, then ask for a chart in plain words. The assistant makes it in your Chartjuice account.

  1. 1

    Add Chartjuice to your assistant

    There is nothing to install. In your assistant's settings, add a connector (sometimes called MCP) and paste this address:

    https://chartjuice.com/mcp
  2. 2

    Sign in and choose Allow

    Your assistant sends you to Chartjuice. Sign in there, or make a free account. Check that the page names your assistant, then choose Allow.

  3. 3

    Ask for a chart

    Start a chat and ask the way you would ask a person. For example:

    • "Make a bar chart from this data."
    • "Make it horizontal and sort it largest first."
    • "Compare this year and last year as two lines, and make this year orange."

The assistant shows you the chart as a picture and gives you a link. The chart is saved to your account, so you can open the link and carry on by hand in the editor.

Connect an AI assistantRead the docs

This is part of every plan, Free included, within your plan's limits.

Frequently asked questions

Is Chartjuice free?

Yes. Making and downloading charts is free, with every chart type and preset palette, and needs no signup. A free account saves up to 5 charts and gives you 3 AI tries. Pro costs $12 a month or $120 a year. It removes the chartjuice.com mark and raises the AI assistant to 50 messages a day. It also adds your brand palette, unlimited saved charts and 3 seats. A Business plan for bigger teams is coming soon. See pricing.

Do I need an account?

No. You can build and download a chart without signing up. A free account lets you save up to 5 charts (rename, duplicate, delete) and try the AI assistant 3 times.

Can I upload an Excel file?

Yes. Click Upload file on the Data tab and choose an XLSX, XLS, ODS, CSV, TSV or TXT file, or drop it anywhere on the designer. You can also click Paste data and paste a block of cells from Excel or Google Sheets. A sheet with a Month column and columns for 2023 and 2024, for example, becomes a bar chart with two bars per month.

How much data can a chart hold?

Up to 5,000 rows and 50 columns, from files up to 20 MB. That is enough for a daily series covering more than 13 years. If a file is bigger, the graph maker keeps the first 5,000 rows and 50 columns and tells you what it left out. A saved chart can be up to 4 MB.

How do I clean up messy data before charting it?

Use the Steps section on the Data tab. Sort orders rows, Filter keeps the rows you want, Top N keeps the biggest rows and adds up the rest as "Other", and Group & total combines rows into totals. For example, a list of 400 orders can become five bars for your best-selling products plus one Other bar. Steps never change your original data. How Chartjuice works walks through each one with an example.

Can AI make the chart for me?

Yes. Click Ask AI and describe the chart, like "make it a donut and sort largest first" or "stacked bars, title it Q3 revenue". Everything it changes is a normal setting you can adjust in the Style tab. It sees your column names and a small sample of rows, not your whole file. Sign in to get 3 free tries, or use it every day with Pro. The AI graph maker page shows what it can and can't do.

What can I download?

PNG at 1x for the web, 2x for slides or 4x for print, with an optional transparent background. SVG stays sharp at any size. Copy image puts the chart on your clipboard to paste into a document or slide. For a slide deck, PNG 2x is usually the right pick. For a poster, use 4x or SVG.

Is my data private?

In the editor, files are read in your browser and never uploaded. The AI assistant sees only your column names and small samples of the data. Chart data is stored only when a chart is saved to an account. If you connect an AI assistant such as Claude, or use the API, the data you give it is sent to Chartjuice to make the chart.

What's the difference between a chart and a graph?

"Graph" usually means data plotted against axes, like a bar graph, line graph or scatter plot. "Chart" is the broader word: it covers graphs plus visuals without axes, like pie charts and sankey diagrams. In everyday use people treat them as the same thing: a bar graph and a bar chart are the same picture, and this graph maker makes both.

Can I use my charts in commercial work?

Yes. Charts you make are yours to use in reports, slides, websites or products. Free downloads carry a small, faint "chartjuice.com" in the bottom-right corner (Pro removes it), and you don't need to credit Chartjuice anywhere else.

Want the full tour? Read how Chartjuice works.

Save your charts with a free account

Making and downloading charts is free and needs no signup. A free account lets you save your charts and come back to edit them later.